Summary and Setup
This lesson is an introduction to programming in Python 3 for people with little or no previous programming experience. It uses plotting as its motivating example and is designed to be used in both Data Carpentry and Software Carpentry workshops. This lesson references JupyterLab but can be taught using alternative Python 3 interpreters as well (e.g., repl.it, Anaconda).
Prerequisites
Learners need to understand what files and directories are, what a working directory is, and how to start a Python interpreter.
Learners must install Python 3 before the class starts.
Learners must get the data before class starts: please download and unzip the file data.zip.
Please see the setup instructions for more details.
Getting the Data
The data we will be using is Palmers penguins dataset, made available by Dr. Kristen Gorman and the Palmer Station.
 {“Meet the Palmer penguins”, Artwork by
@allison_horst}
{“Meet the Palmer penguins”, Artwork by
@allison_horst}
The following figure gives a visual description of some information in the dataset:
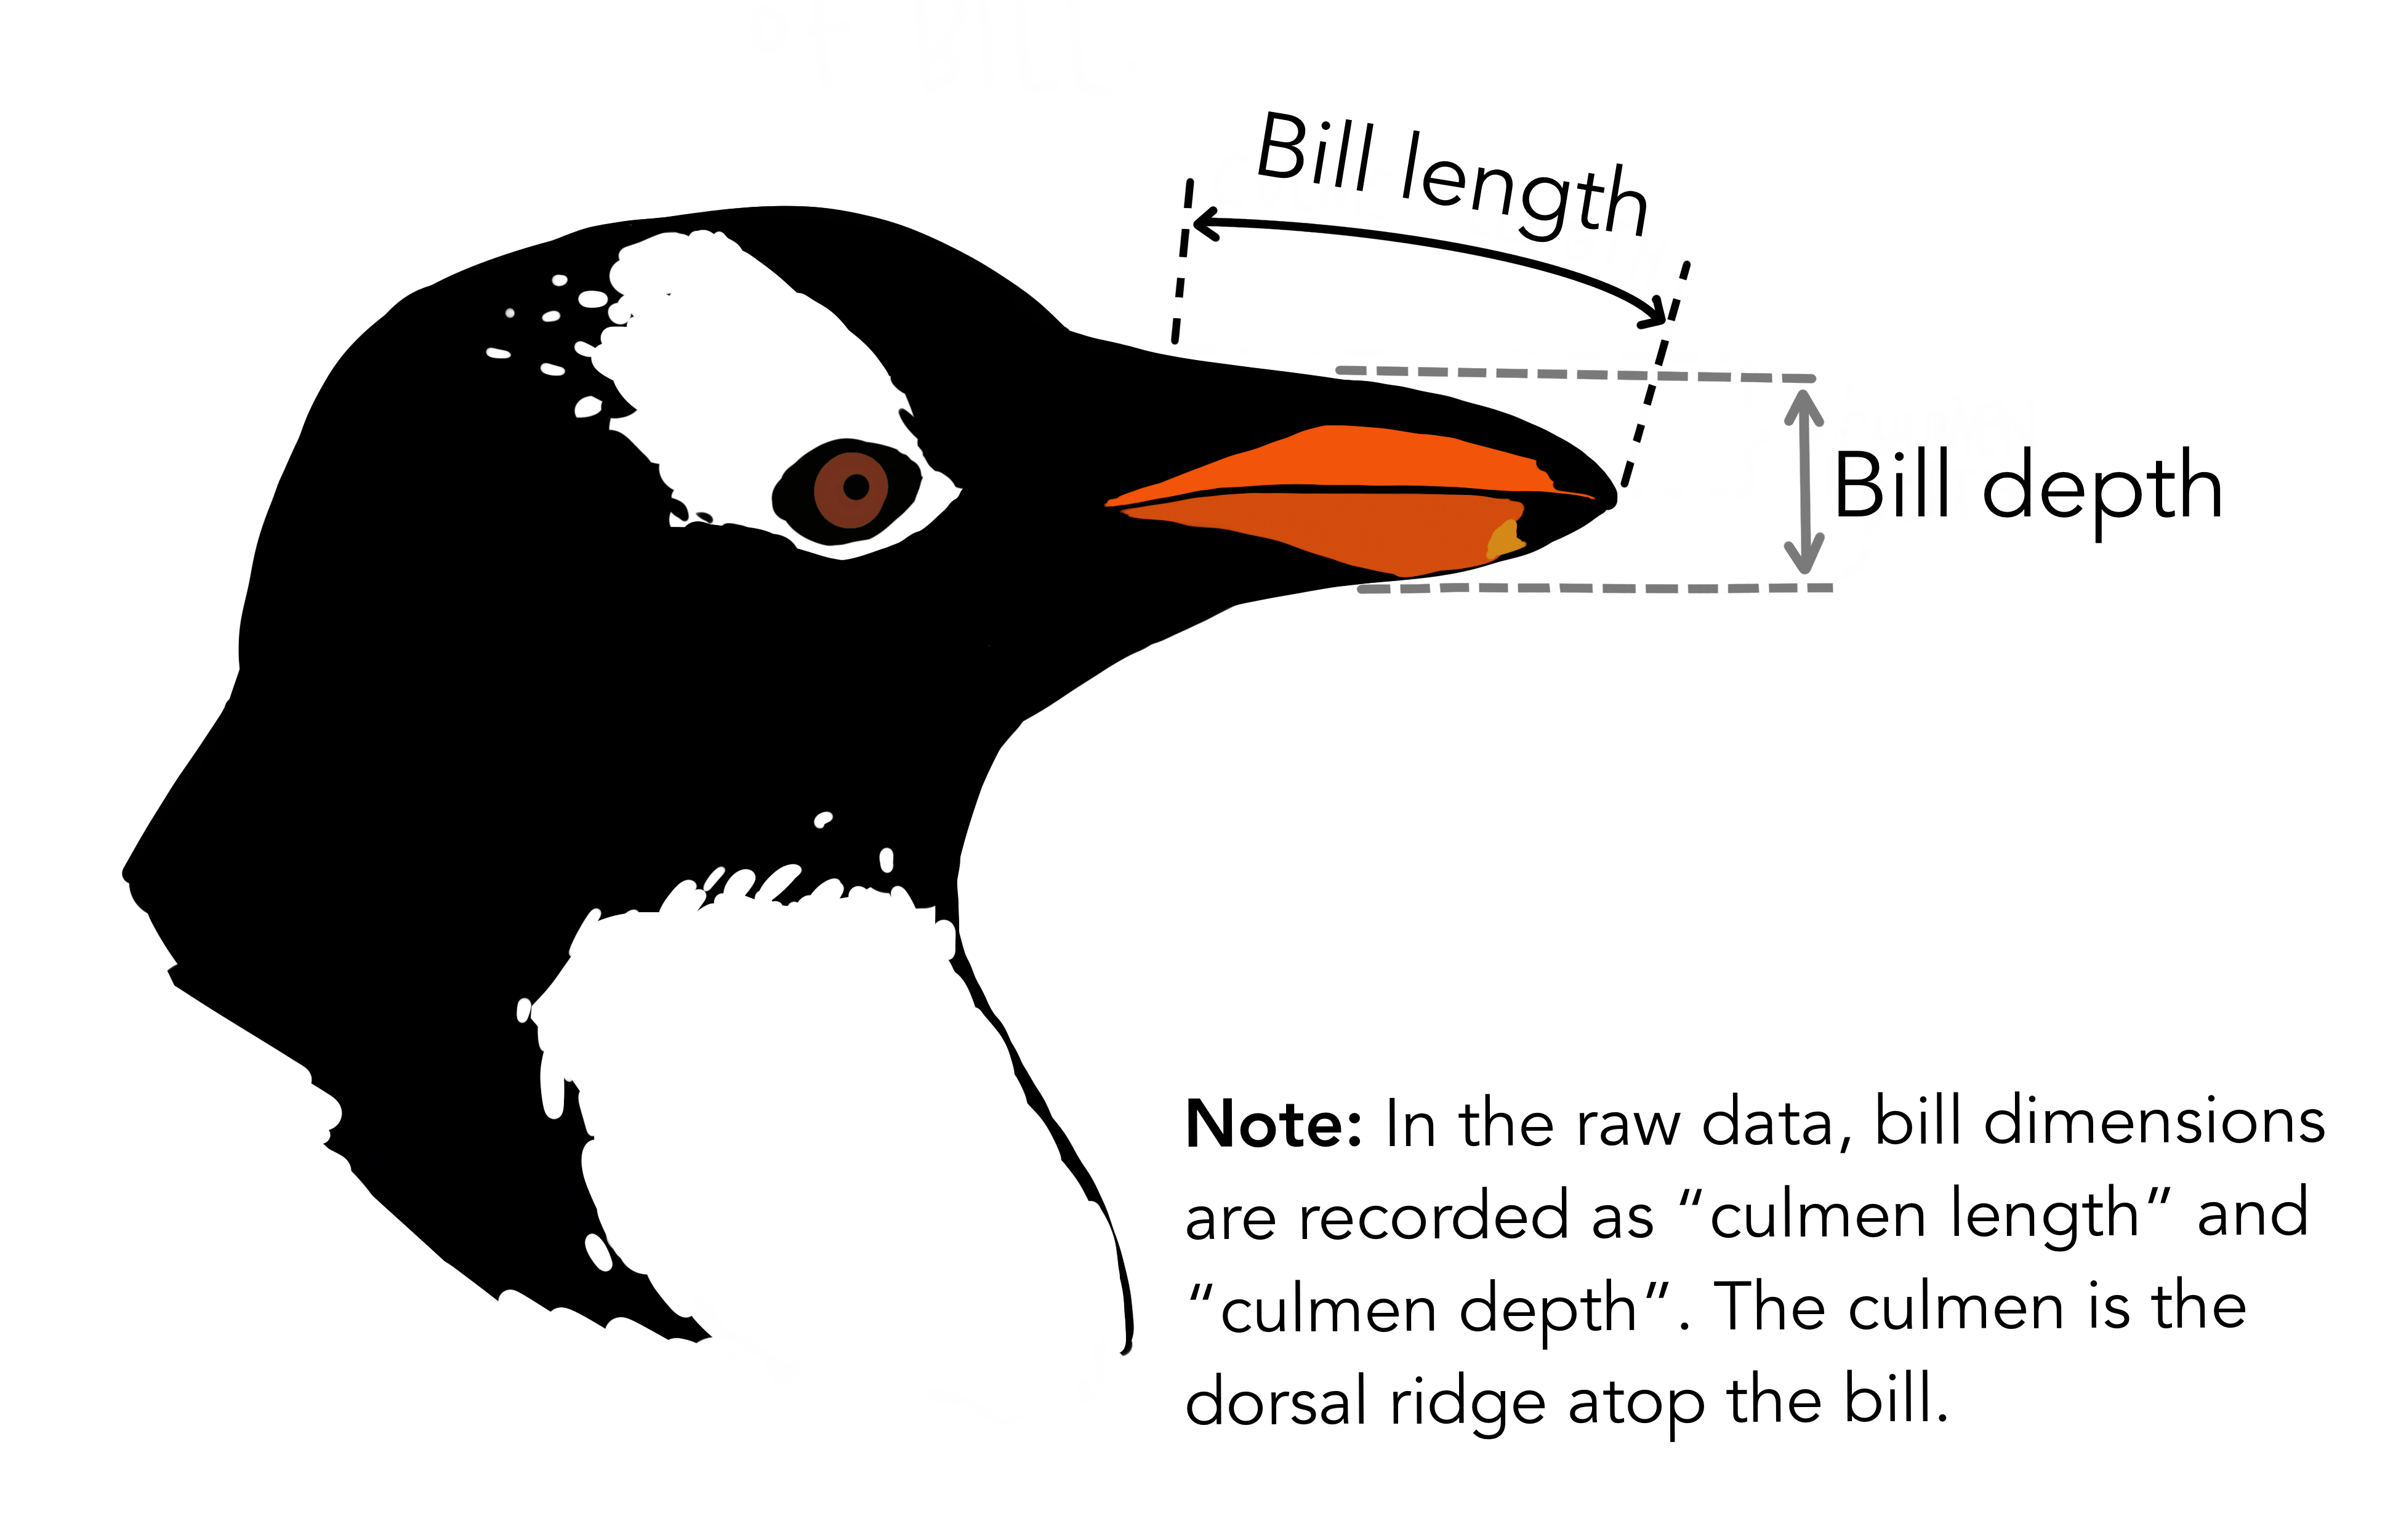 {“Bill dimensions”, Artwork by
@allison_horst}
{“Bill dimensions”, Artwork by
@allison_horst}
We will also be using the breast cancer Wisconsin dataset in various parts of the course. To obtain all the data, download and unzip the file data.zip. In order to follow the presented material, you should launch the JupyterLab server in the root directory (see Starting JupyterLab).
Installing Python Using Anaconda
Please refer to the Python section of the workshop website for installation instructions.